Introduction
In the realm of human resources, mastering employee attrition analysis is pivotal for workforce management. This blog is not a how-to; instead, it’s a quick guide for HR professionals. We’ll outline the key data you need, unravel the process, and highlight the benefits. Empower yourself with insights to strategically enhance talent retention. Let’s dive in.
Why Conduct an Attrition Analysis: Mitigating Business Impact
Attrition poses a ubiquitous challenge across industries, geographies, and company sizes. The repercussions of employee turnover extend far beyond the immediate need to fill vacancies, reaching into the realms of business disruption, recruitment costs, and the resources invested in training new personnel. In this landscape, the application of classification models emerges as a powerful tool to predict the likelihood of an employee resigning, providing HR teams with a proactive means to intervene and address potential attrition triggers.
About the Data: Unpacking Essentials for Attrition Analysis
Crucial to any effective attrition analysis is a reliable dataset, and a good example is an employee survey of IBM. This dataset, featuring responses from 1,470 employees, is a renowned cornerstone in the domain of attrition analysis.
| Name | Description |
|---|---|
| AGE | Numerical Value |
| ATTRITION | Employee leaving the company (0=no, 1=yes) |
| BUSINESS TRAVEL | (1=No Travel, 2=Travel Frequently, 3=Tavel Rarely) |
| DAILY RATE | Numerical Value - Salary Level |
| DEPARTMENT | (1=HR, 2=R&D, 3=Sales) |
| DISTANCE FROM HOME | Numerical Value - THE DISTANCE FROM WORK TO HOME |
| EDUCATION | Numerical Value |
| EDUCATION FIELD | (1=HR, 2=LIFE SCIENCES, 3=MARKETING, 4=MEDICAL SCIENCES, 5=OTHERS, 6= TEHCNICAL) |
| EMPLOYEE COUNT | Numerical Value |
| EMPLOYEE NUMBER | Numerical Value - EMPLOYEE ID |
| ENVIROMENT SATISFACTION | Numerical Value - SATISFACTION WITH THE ENVIROMENT |
| GENDER | (1=FEMALE, 2=MALE) |
| HOURLY RATE | Numerical Value - HOURLY SALARY |
| JOB INVOLVEMENT | Numerical Value - JOB INVOLVEMENT |
| JOB LEVEL | Numerical Value - LEVEL OF JOB |
| JOB ROLE | (1=HC REP, 2=HR, 3=LAB TECHNICIAN, 4=MANAGER, 5= MANAGING DIRECTOR, 6= REASEARCH DIRECTOR, 7= RESEARCH SCIENTIST, 8=SALES EXECUTIEVE, 9= SALES REPRESENTATIVE) |
| JOB SATISFACTION | Numerical Value - SATISFACTION WITH THE JOB |
| MARITAL STATUS | (1=DIVORCED, 2=MARRIED, 3=SINGLE) |
| MONTHLY INCOME | Numerical Value - MONTHLY SALARY |
| MONTHY RATE | Numerical Value - MONTHY RATE |
| NUMCOMPANIES WORKED | Numerical Value - NO. OF COMPANIES WORKED AT |
| OVER 18 | (1=YES, 2=NO) |
| OVERTIME | (1=NO, 2=YES) |
| PERCENT SALARY HIKE | Numerical Value - PERCENTAGE INCREASE IN SALARY |
| PERFORMANCE RATING | Numerical Value - ERFORMANCE RATING |
| RELATIONS SATISFACTION | Numerical Value - RELATIONS SATISFACTION |
| STANDARD HOURS | Numerical Value - STANDARD HOURS |
| STOCK OPTIONS LEVEL | Numerical Value - STOCK OPTIONS |
| TOTAL WORKING YEARS | Numerical Value - TOTAL YEARS WORKED |
| TRAINING TIMES LAST YEAR | Numerical Value - HOURS SPENT TRAINING |
| WORK LIFE BALANCE | Numerical Value - TIME SPENT BEWTWEEN WORK AND OUTSIDE |
| YEARS AT COMPANY | Numerical Value - TOTAL NUMBER OF YEARS AT THE COMPNAY |
| YEARS IN CURRENT ROLE | Numerical Value -YEARS IN CURRENT ROLE |
| YEARS SINCE LAST PROMOTION | Numerical Value - LAST PROMOTION |
| YEARS WITH CURRENT MANAGER | Numerical Value - YEARS SPENT WITH CURRENT MANAGER |
While not all variables may be necessary for every analysis, this dataset provides a solid foundation, offering a glimpse into what it takes to conduct a nuanced and insightful attrition analysis.
Understanding the Extent of Attrition in Your Business: A Strategic Overview
Once armed with attrition data categorized by department and job role, you and your data scientist can venture into estimating the tangible impact of attrition costs on your business. Consider the following example, which draws on specific assumptions related to salary, direct costs (such as separation, vacancy, acquisition, and placement), and productivity costs (including net revenue per employee and other factors).
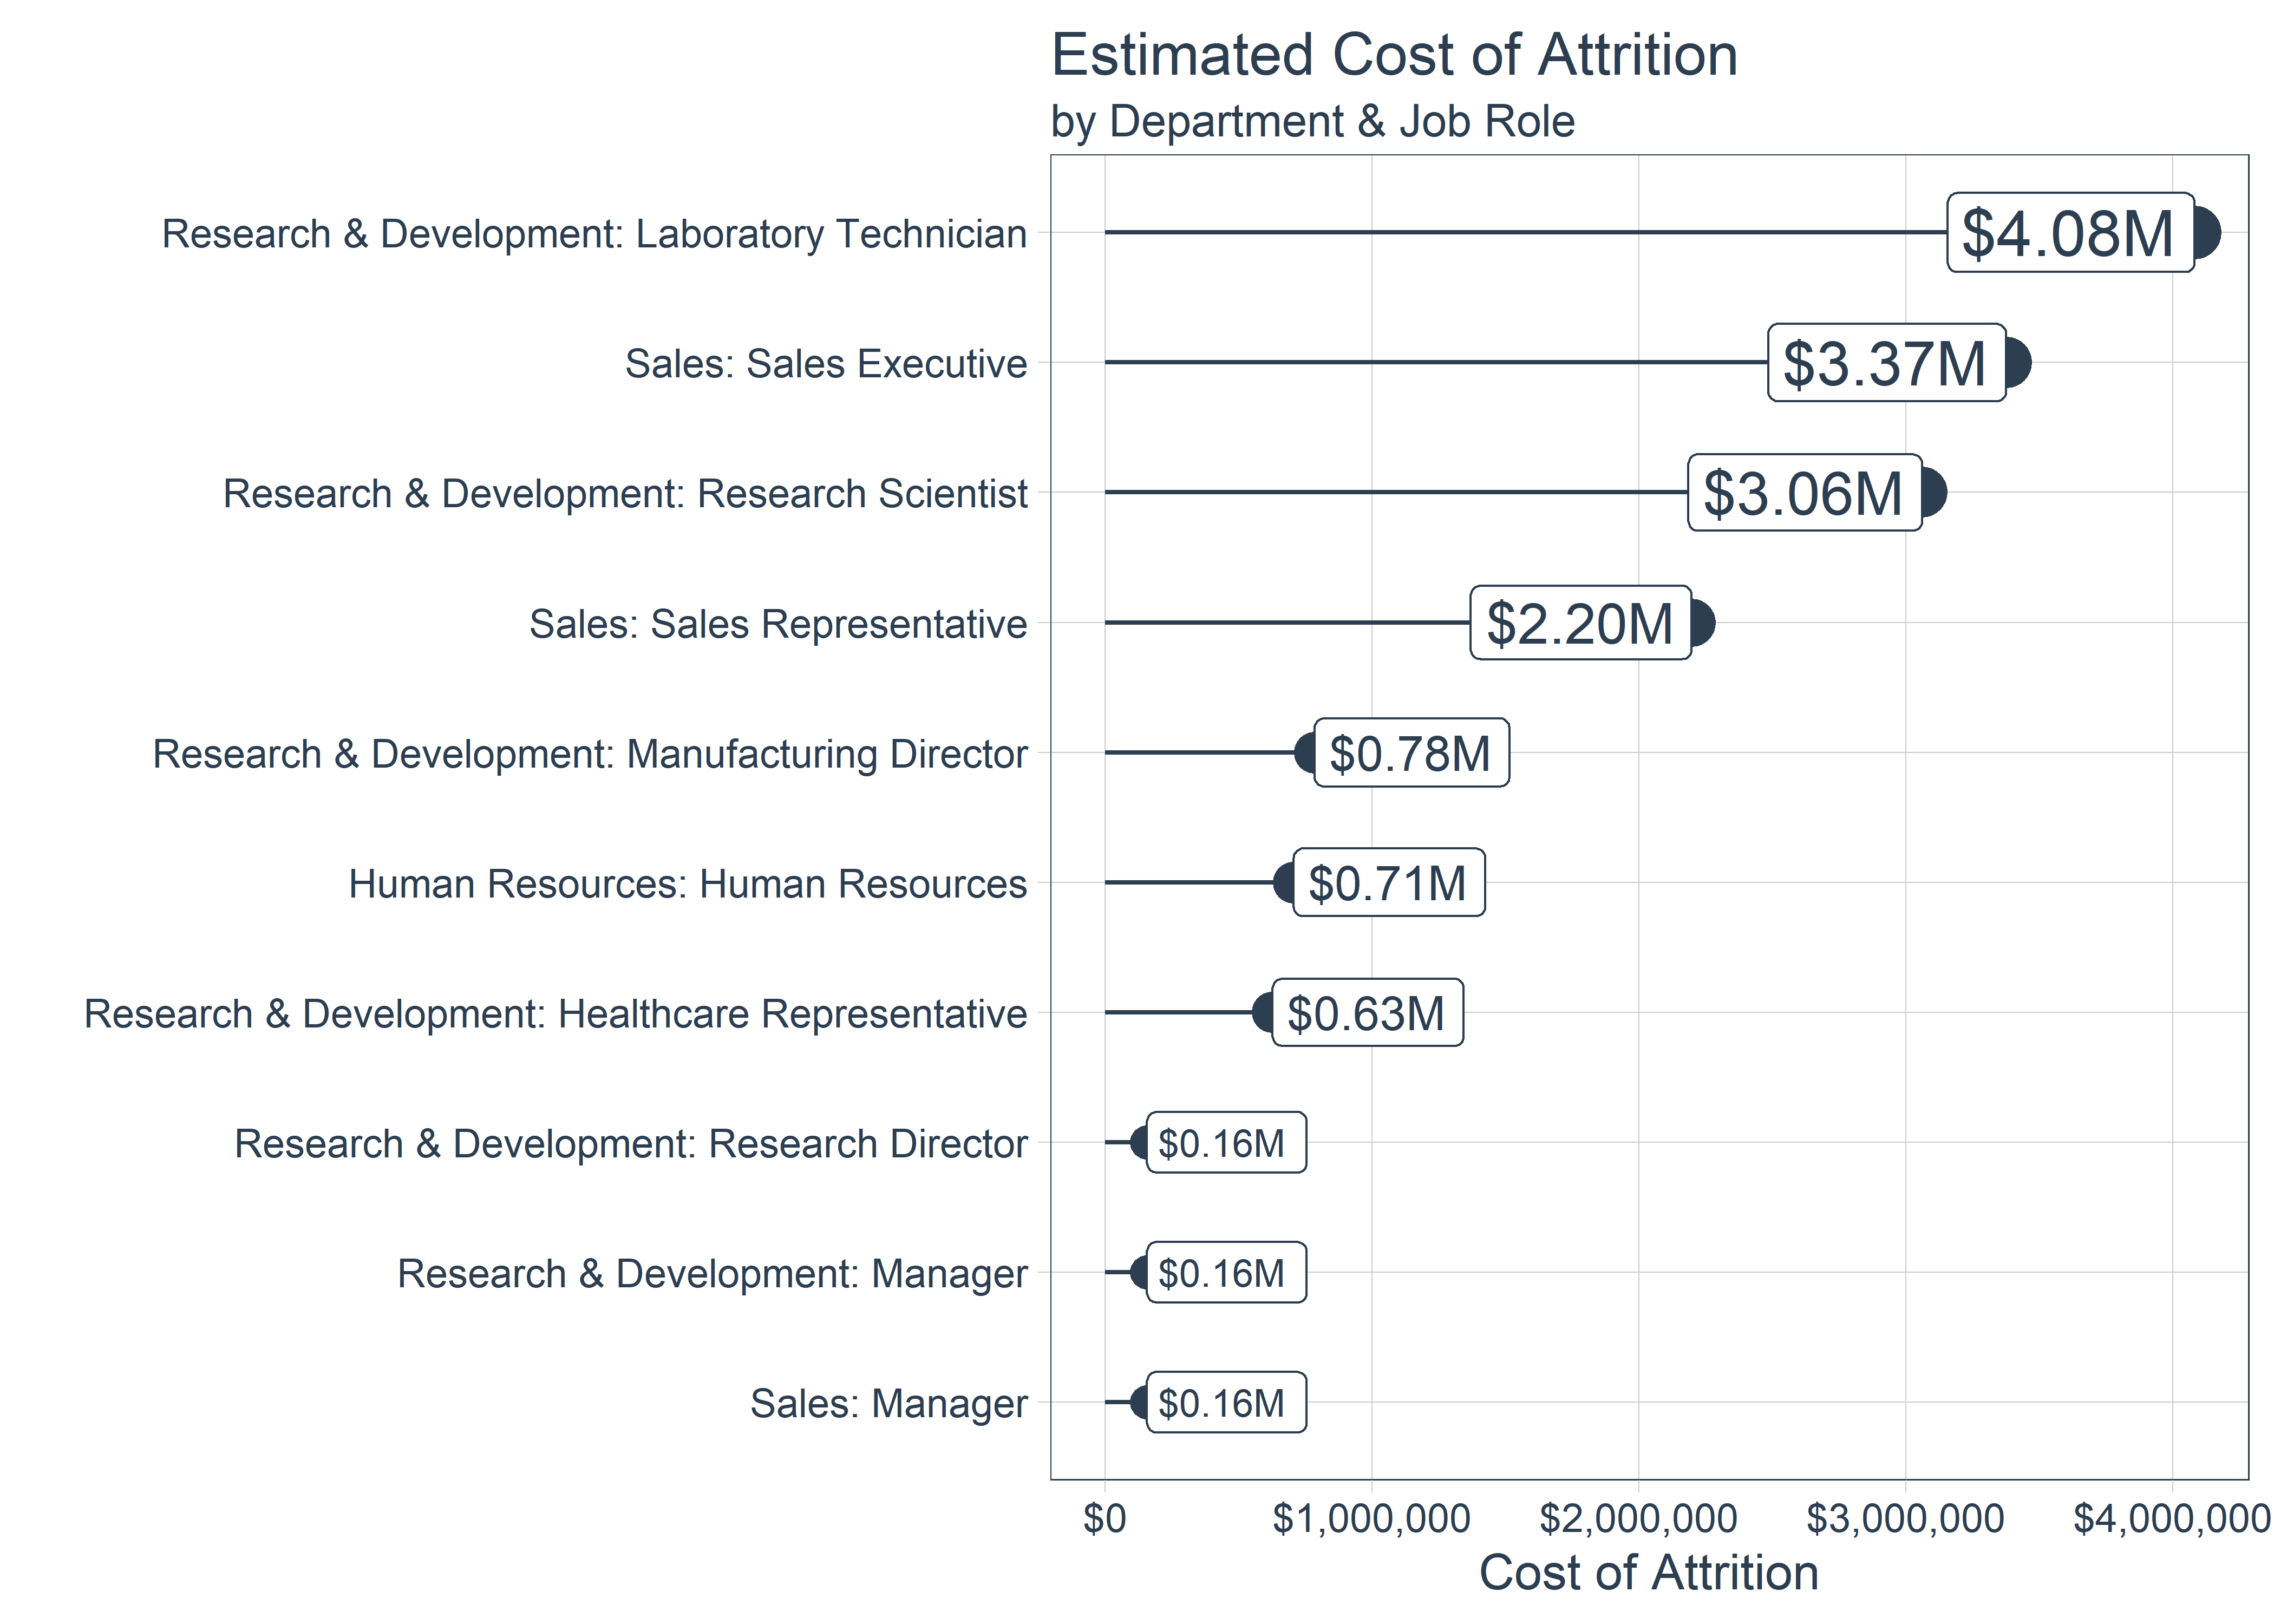
In the depicted scenario, IBM illustrates the highest attrition cost within the sales department, particularly among sales executives. Following closely are lab technicians in the Research and Development (R&D) department. This insightful plot unveils the specific areas within your organization where attrition poses the most significant financial implications.
Do I Have Sufficient Data? Deciphering Data Quality
Determining the adequacy of your data is a pivotal step in the analytical journey. Typically, your data scientist will embark on an exploratory data analysis (EDA) to provide insights into the quality and relevance of your dataset. While various approaches exist for EDA, one effective and insightful method is the correlation funnel analysis, a personal favorite.
The correlation funnel analysis is particularly powerful as it not only reveals correlations between the target variable (attrition) and numeric variables but also extends its reach to categorical variables through the binarization of variables. This comprehensive approach offers an intuitive visualization of variables, showcasing their potential predictive power in a structured hierarchy.
This stage becomes a collaborative effort between you and your data scientist to decide whether to proceed to the development of machine learning models or revisit data collection. This analytical checkpoint serves as a crucial juncture, ensuring that the data at hand possesses the depth and relevance necessary for meaningful insights.
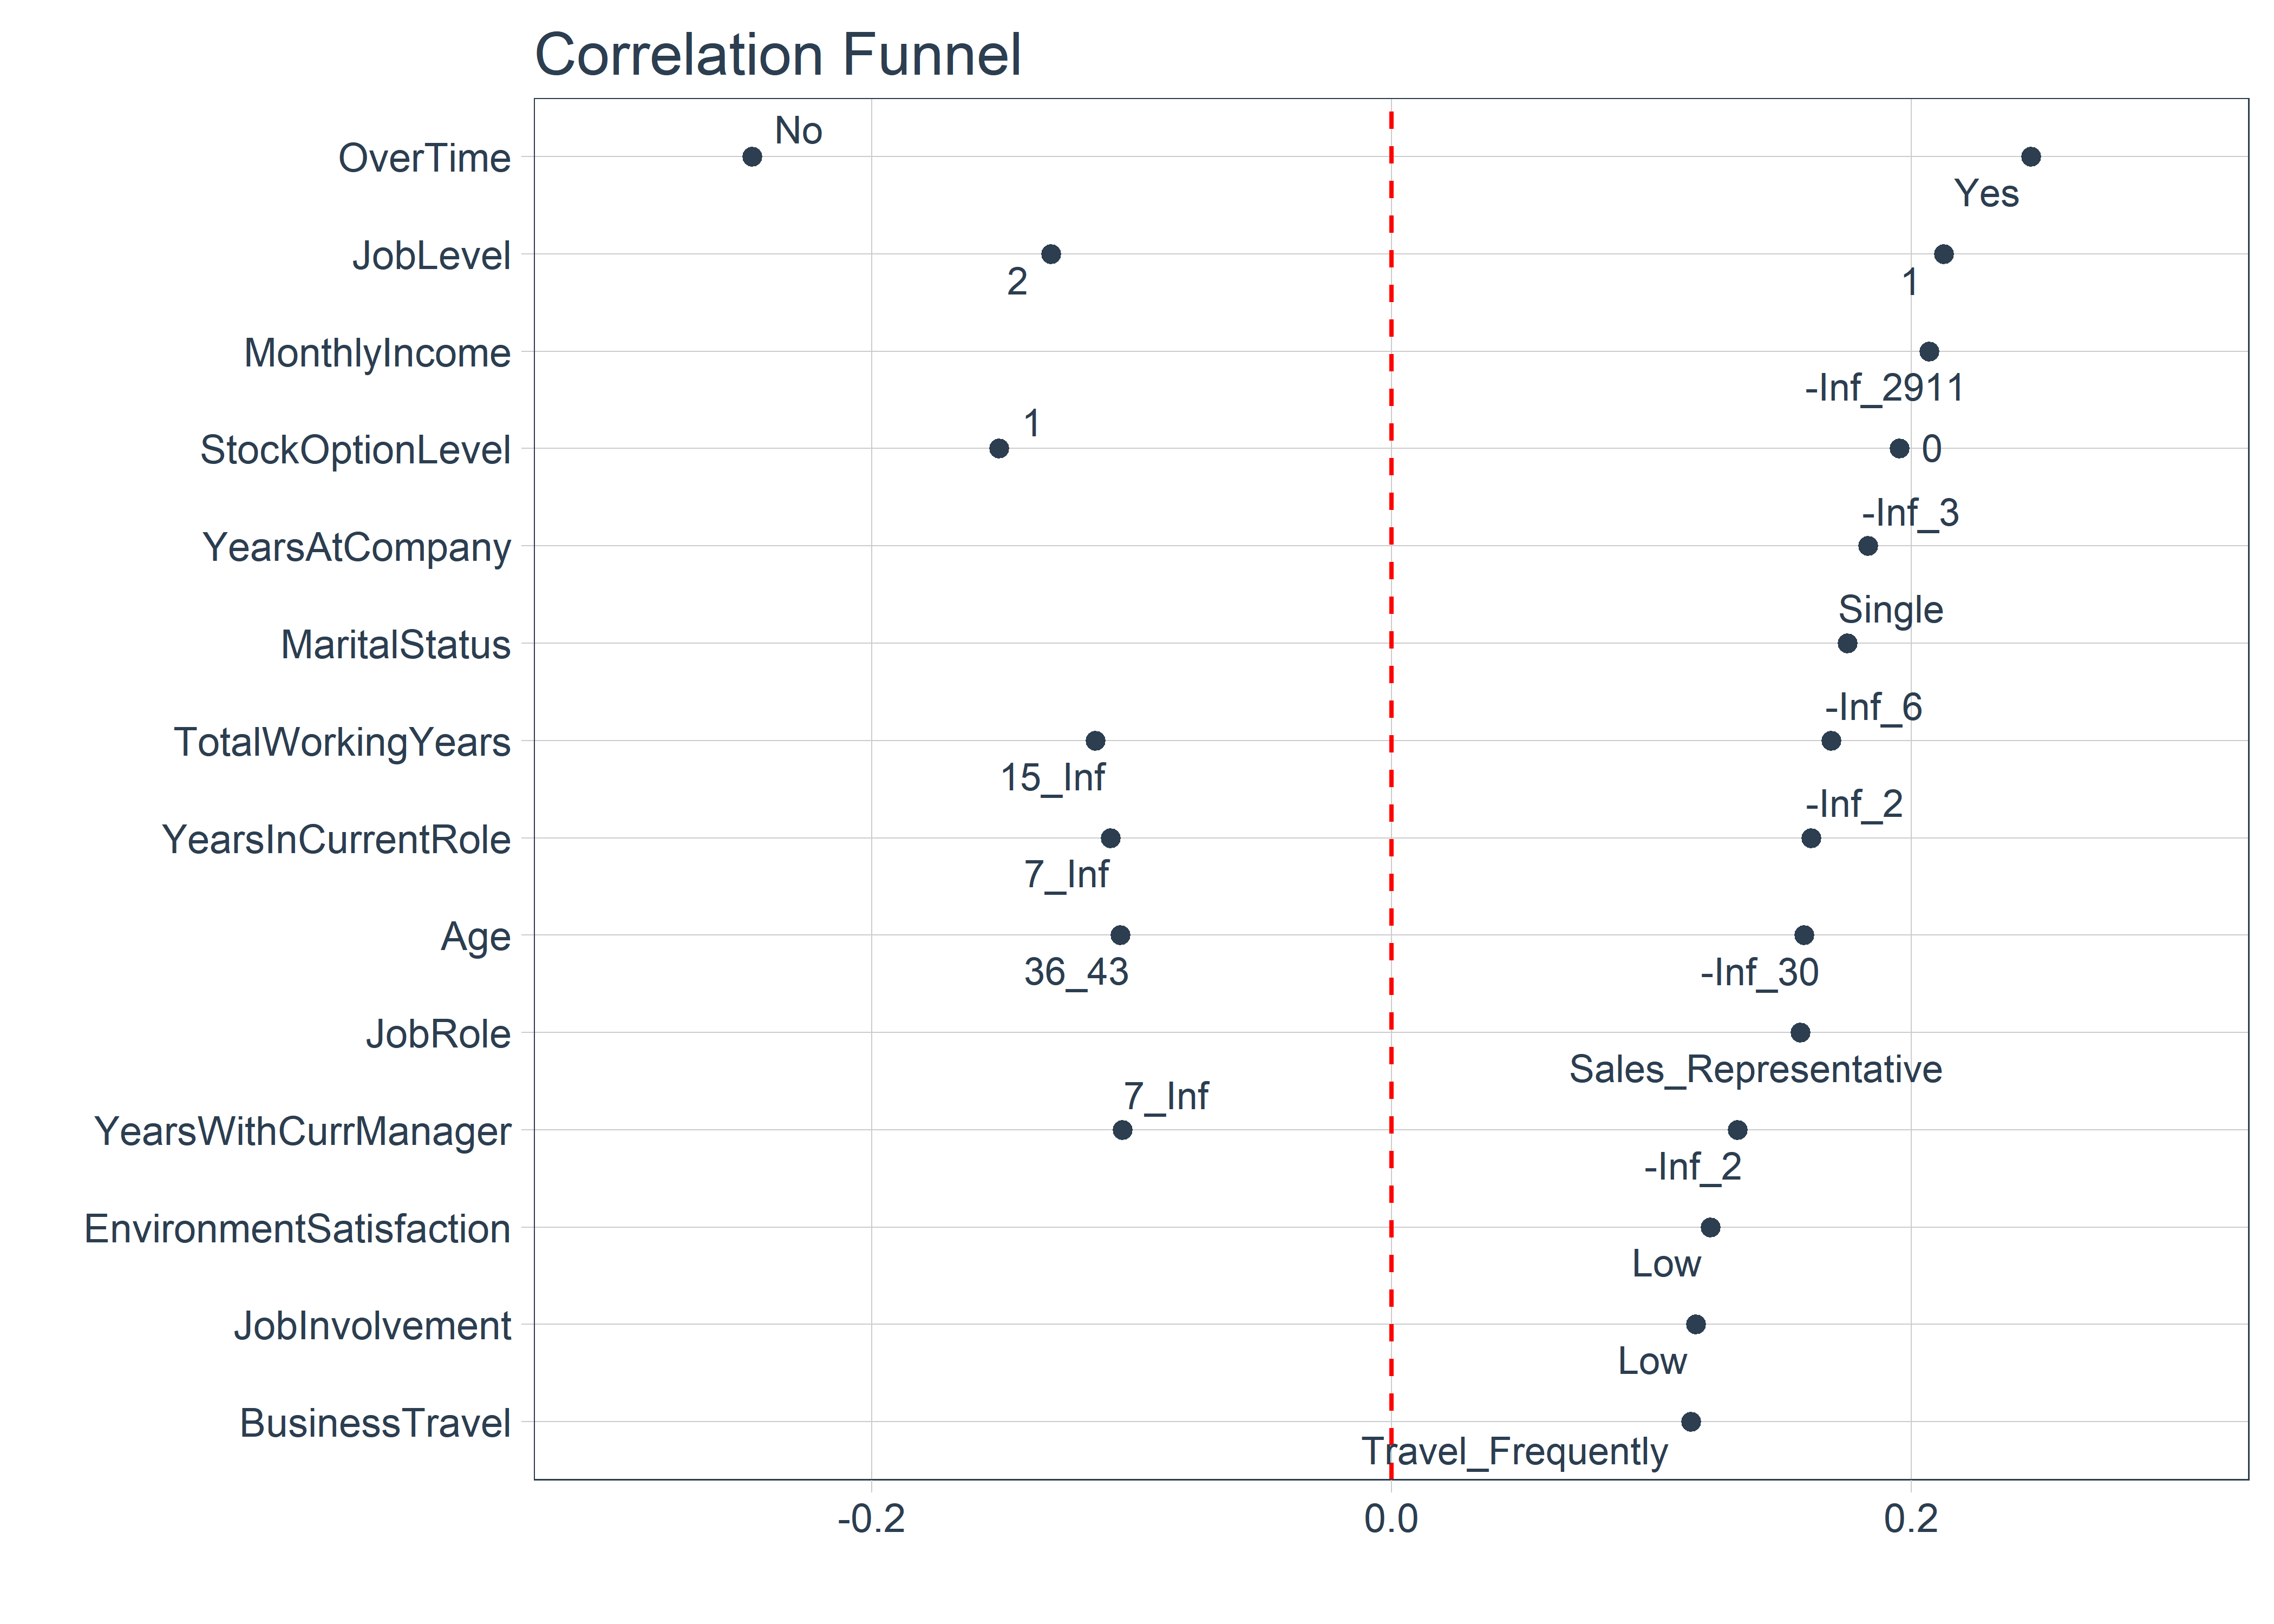
The correlation funnel plot serves as a visual guide to discern variables strongly correlated with attrition, providing a structured view of their significance in descending order. Within this plot, the right half showcases binarized variables correlated with employees who left the company, while the left half displays those correlated with employees who stayed.
The top variables, with the highest correlations in order, are OverTime, JobLevel, MonthlyIncome, and StockOptionLevel. Let’s delve into a detailed explanation, focusing on the top three predictors:
OverTime: Employees who work overtime are more likely to leave the company, suggesting a potential correlation between extended work hours and attrition.
JobLevel: Junior-level employees (level 1 on a scale of 1 through 5) exhibit a higher likelihood of leaving, while those at job level 2 are less prone to attrition. It may imply that a swift promotion of talented employees to Job Level 2 could help mitigate attrition, underscoring the strategic importance of career progression.
MonthlyIncome: Employees earning a monthly income of $2,911 or lower are more likely to leave. This correlation underscores the influence of income levels on attrition dynamics.
Building Machine Learning Models: Unleashing Analytical Power
Leave the intricacies to your data scientist; it’s their realm of expertise, allowing you to take a step back and relax. The results that follow have been crafted using Matt Dancho’s code from Business Science University, applied to the previously discussed IBM employee survey data.
Why Should I Trust the Model? Unraveling Predictive Confidence
When assessing the reliability of the model, your data scientist will provide you with various performance metrics, offering a comprehensive view of its predictive capabilities. Among these metrics, common ones include AUC (Area Under the Curve) and accuracy.
Accuracy: This is perhaps the most intuitive metric, representing the percentage of correct predictions made by the model.
AUC: Without delving into technical details, AUC is easily understandable. Ranging from 0 to 1, a score of 0 signifies the model being 100% wrong, while a score of 1 indicates 100% correctness. Notably, our IBM case study boasts a commendable AUC of 0.92 and an Accuracy of 0.9, signifying robust predictive performance.
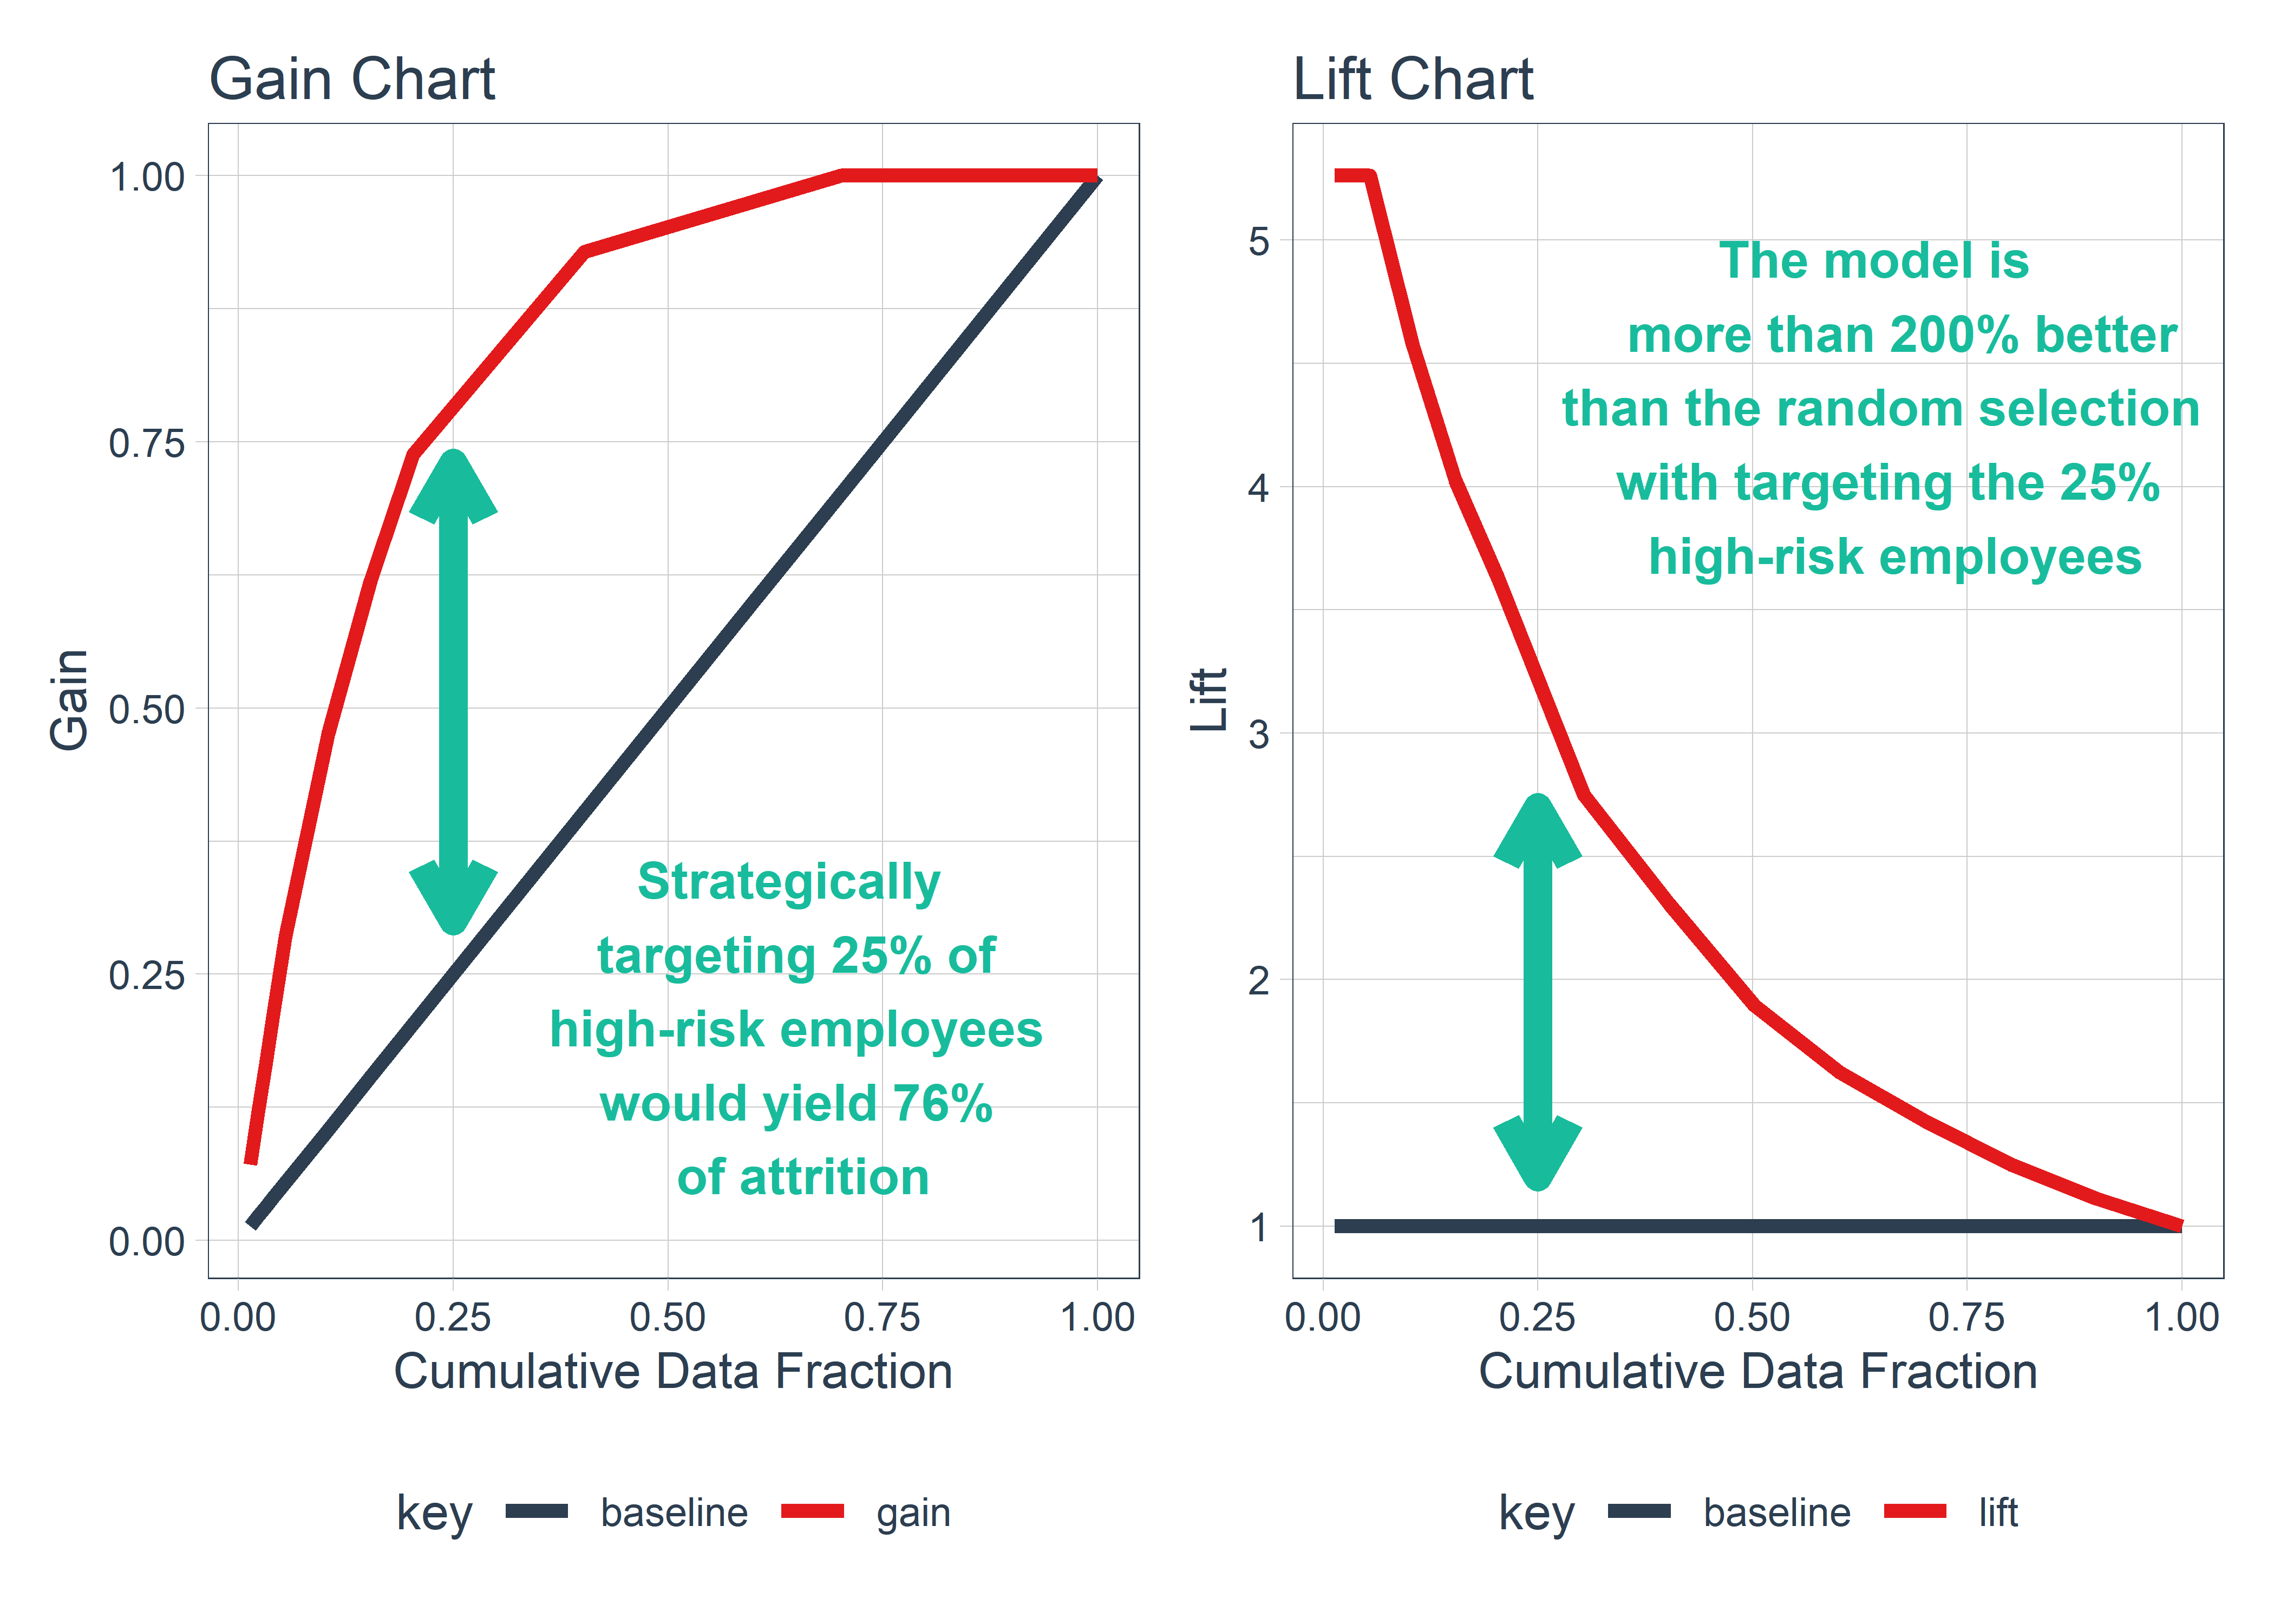
Despite the array of performance metrics, two that are likely to catch your attention are the lift chart and gain chart, both highlighted in the IBM case study below. These charts provide an insightful visual representation of the model’s effectiveness in predicting attrition, offering a practical and easily interpretable measure of its performance.
In the realm of complex models, however, establishing trust can be challenging. Global measures like accuracy provide a high-level view, but they often fall short when it comes to explaining the rationale behind specific predictions. Fortunately, your data scientist is equipped to demystify the model’s decisions, offering insightful explanations for why an employee is predicted to leave or stay.
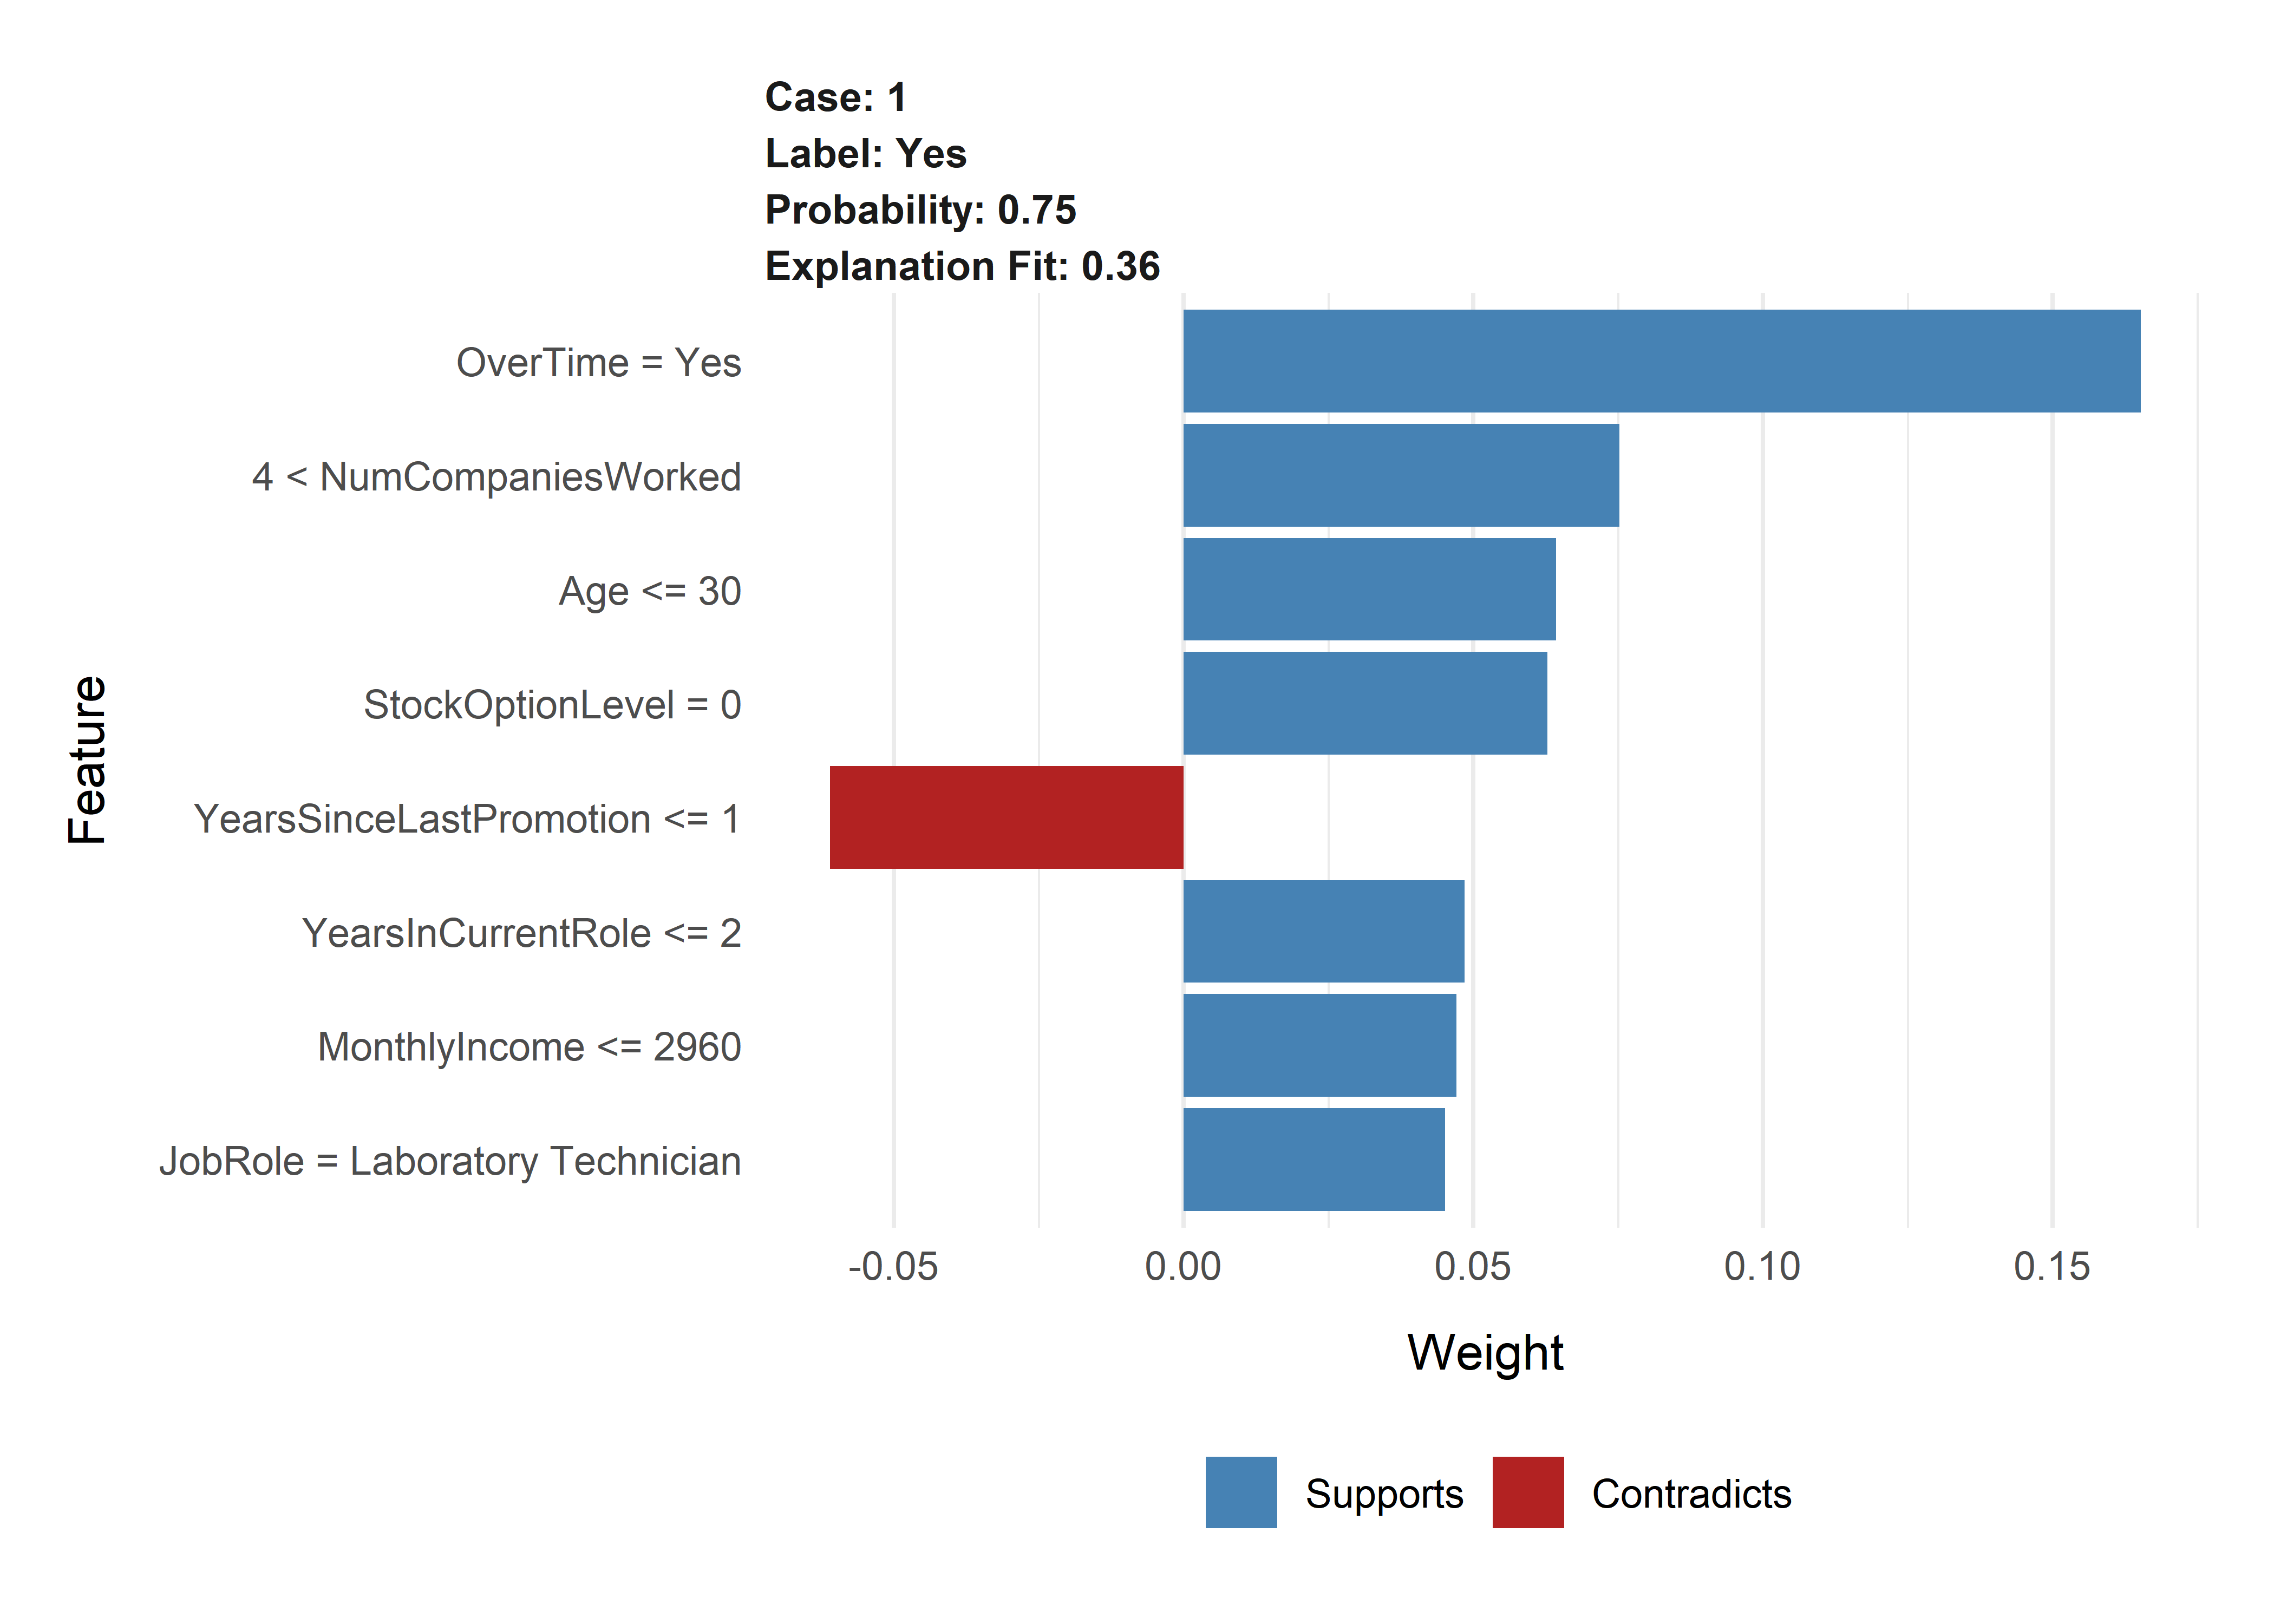
To demystify the estimated probability of an individual employee leaving the company, let’s examine a real-life example from an IBM employee’s case. The model predicted a 75% chance of this employee departing, presenting supporting factors in blue and contradicting factors in red.
Employee Profile:
Overtime: The employee regularly works overtime. Job History: Bounced around frequently, having worked for more than four companies in the past. Age: Young, aged 30 years or younger. Stock Options: The employee has not been offered any stock options. These factors, highlighted in blue, collectively contribute to an increased likelihood of the person leaving. Conversely, a contradicting factor, depicted in red, suggests good career advancement with less than a year since the last promotion.
This nuanced analysis provides a detailed perspective on the specific elements influencing the model’s prediction for this employee.
Policy Recommendations: Strategically Navigating Attrition
As your analytical journey reaches its culmination, your data scientist steps forward with insightful recommendations aimed at mitigating attrition within your organization. These recommendations are not only tailored to address specific attrition drivers but also accompanied by estimated savings tied to each proposed policy change.
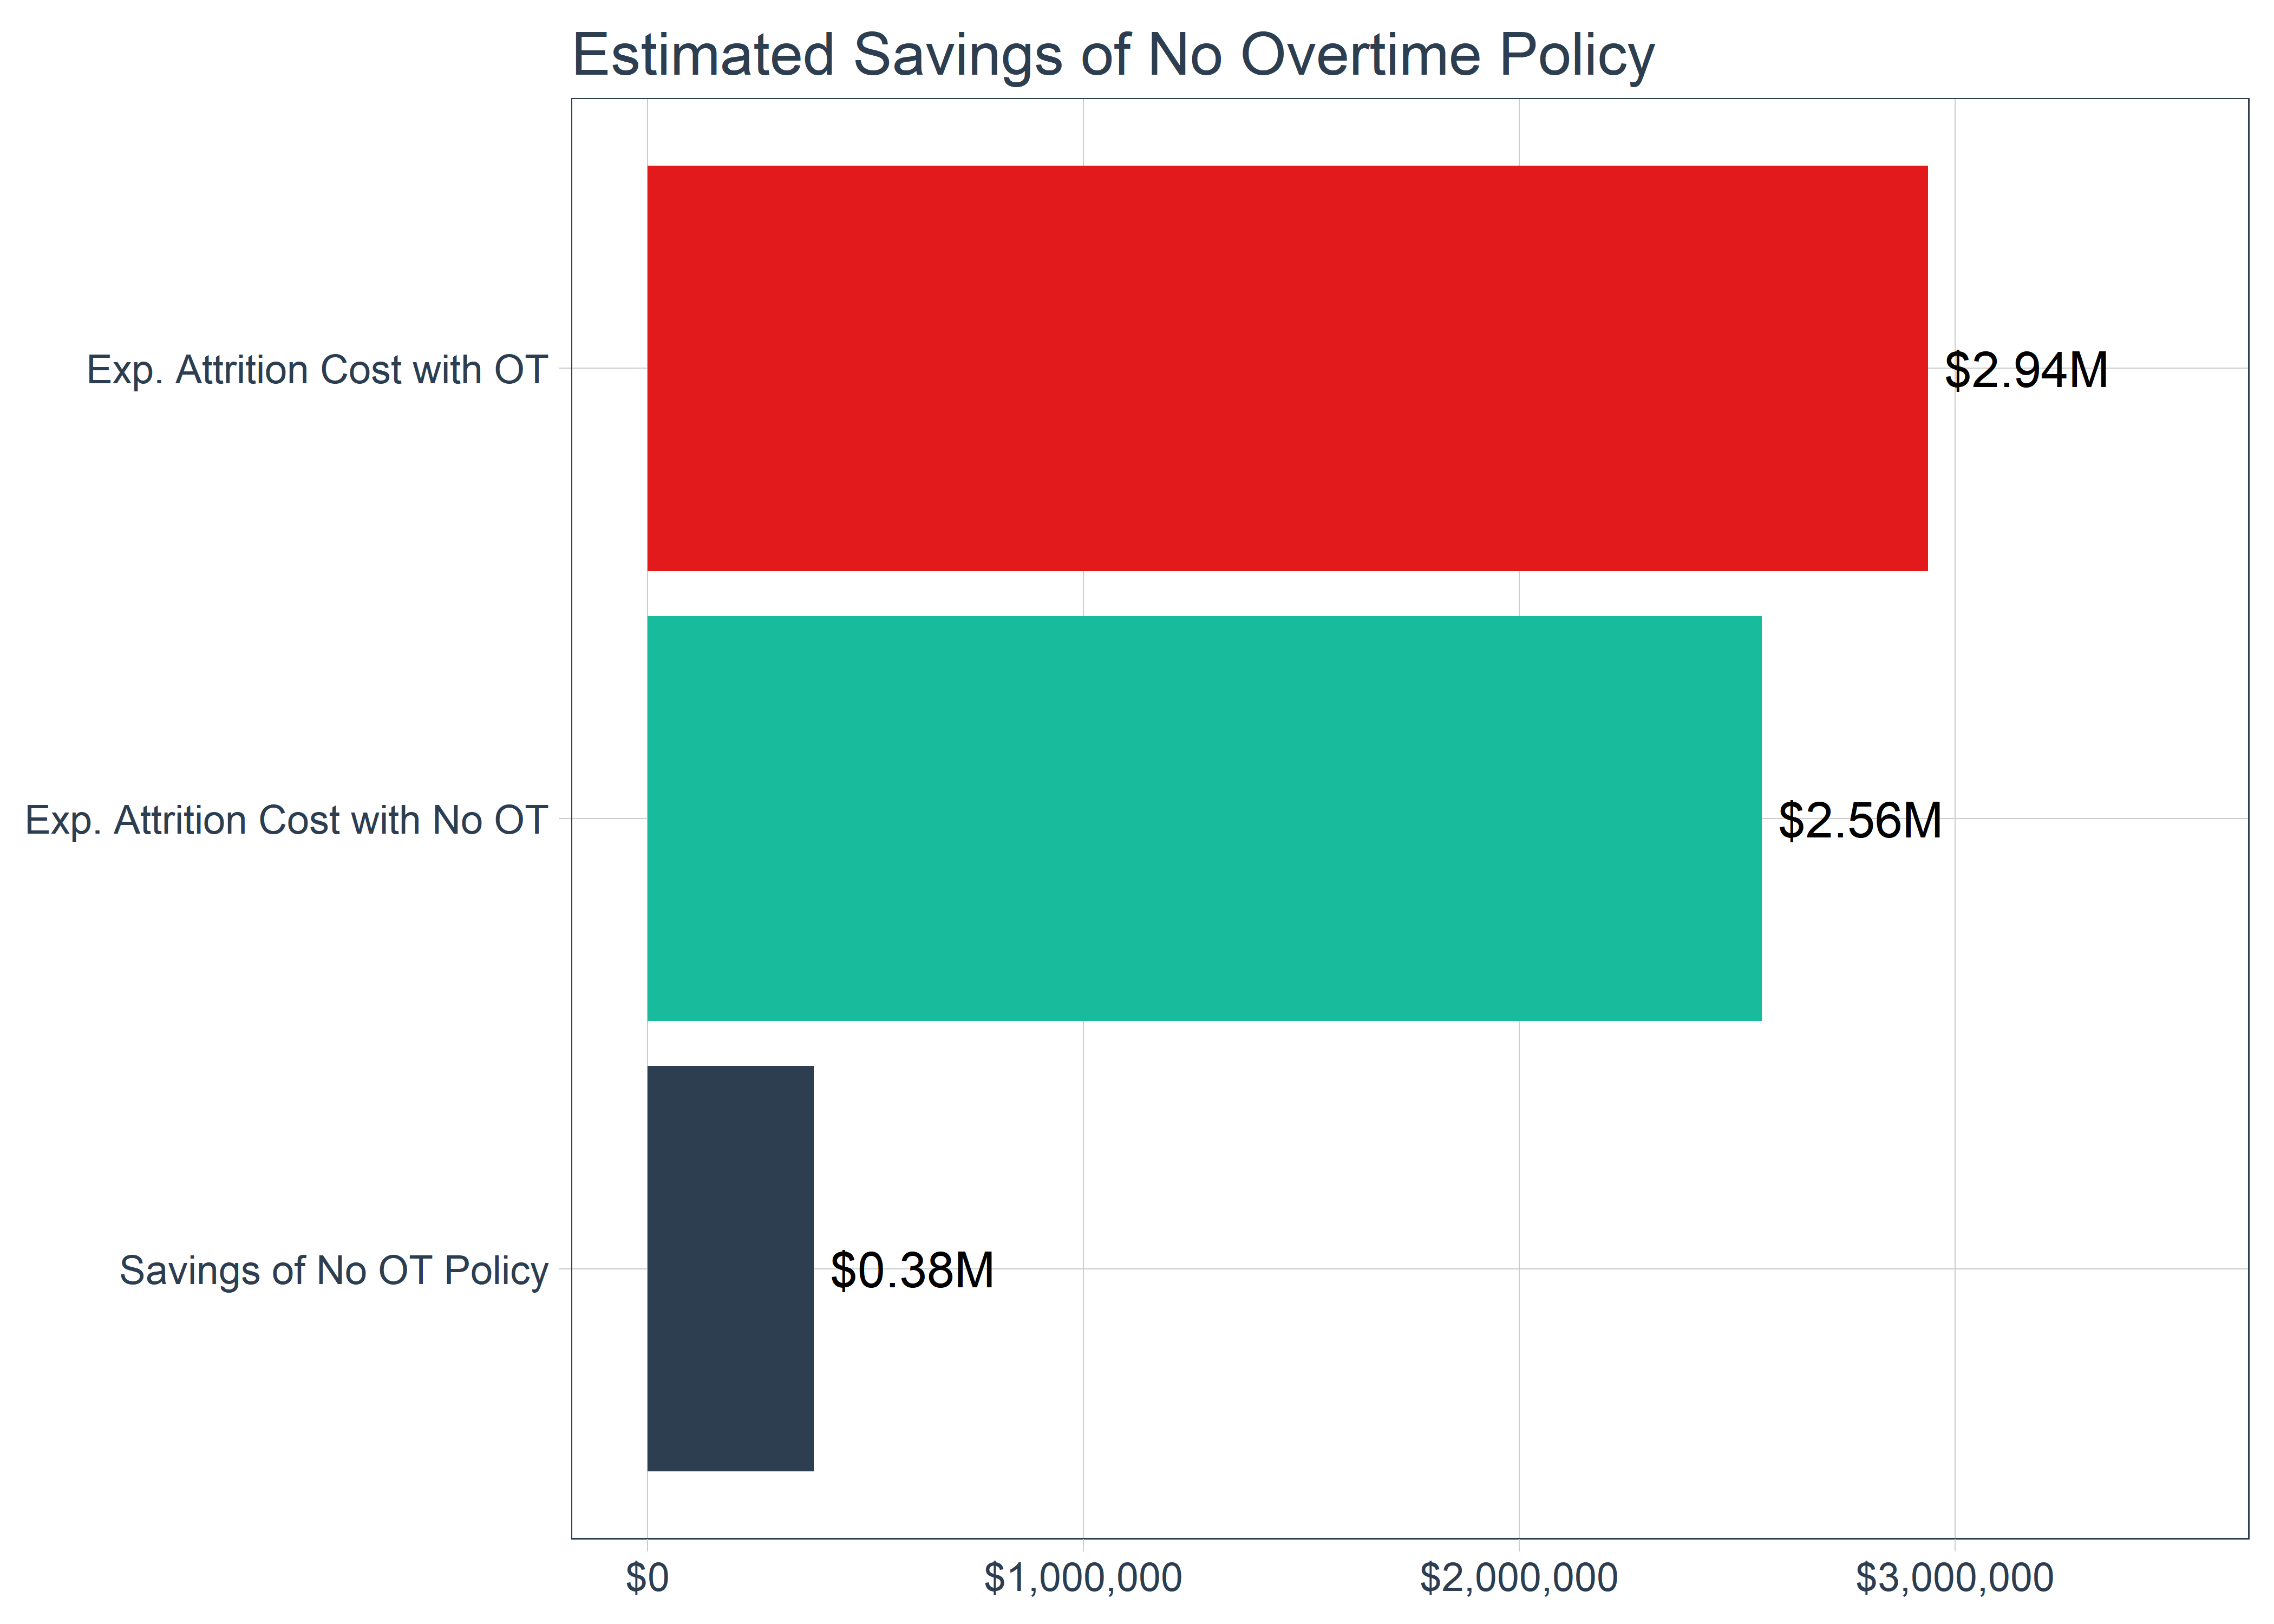
In this IBM case study, for instance, the data scientist may advocate for policy adjustments related to overtime, such as the complete elimination of overtime or its selective removal for targeted employees. To illustrate, a straightforward policy change, like eliminating overtime altogether, could result in annual savings of nearly $400,000 for IBM.
Thank you for taking the time to read my post. I trust it provides valuable insights into the intricacies of conducting an attrition analysis and sets clear expectations for the outcomes of such a study.