Part4: Identifying pivotal variables influencing customer ratings using machine learning
It’s amazing that we’re at the last part of our summer data series. We’ve been talking about what my consulting business, Daniel Lee Consulting LLC, can do. Now, in this last part, we’re going to look deeply into some information we got from TripAdvisor about ski areas in northern New England. Our goal is to figure out the important things that affect how customers rate these ski areas through the power of a machine learning model.
Remember what we talked about in Part 3? We found out a lot from reviews that people write online. This time, we’re using that information again. It helps us understand more and adds to what we already know. For example, we learned in Part 3 how many visitors from other countries come to the region. I didn’t know this when I used to work as an expert on tourism in New Hampshire ten years ago.
As we go into this last part, the main idea is still clear: online feedback from customers can make a big difference for businesses on the internet. This feedback helps us understand what customers like, improve their experiences, and make businesses more successful.
I want you to come along on this final part of our journey as we learn about machine learning and find out the important things that affect how ski areas are rated. Everything we’ve talked about shows how useful data and information can be for all kinds of businesses. It’s a way to make the future better and smarter.
Data
If you’re curious about the data we used for our analysis, you can find a lot of information in the Data section of Part 1. If you want, you can directly click on this link: Part 1 Link.
Our journey with data started by collecting customer reviews from the internet about ski places in Maine, New Hampshire, and Vermont. We got these reviews from a website called TripAdvisor. The picture below shows a little bit of the reviews we used for our analysis.
The crux of our methodology involved crafting a machine learning model to predict customer review ratings. This model harnessed the power of the customer reviews we dissected in Part 3 and the amenity information explored in Part 2. It included metrics such as the count of nearby restaurants, attractions, tours, and tour types.
Just like what we did in Part 3, we explored the words in the reviews to understand them better. We broke these words into smaller parts called tokens (i.e., tokenization). We also changed the words to their basic forms to simplify the text (i.e., lemmatization). Moreover, we labeled the grammatical roles of each word—whether it served as a noun, verb, or adjective—via part of speech tagging.
In modeling, we focused exclusively on nouns, utilizing them as predictors. These nouns, extracted from the customer reviews, form the linguistic foundation upon which our machine learning model thrived. With this robust methodology in place, we embarked on a journey to uncover the interplay between textual insights and amenity metrics to predict customer review ratings.
Analysis and Findings
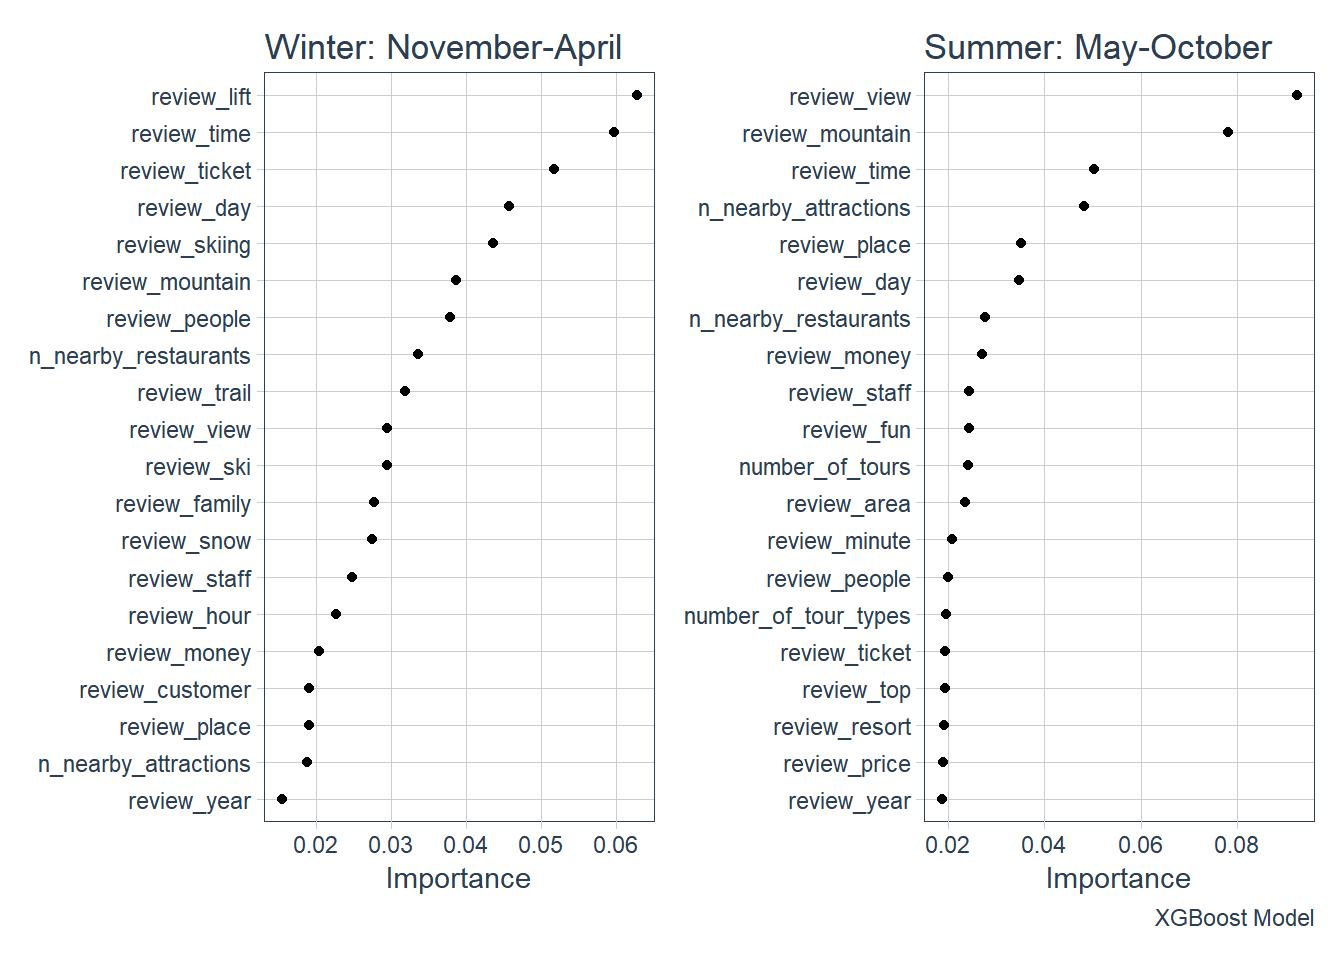
Let’s take a moment to explore the chart below, offering a glimpse into the outcomes of our constructed machine learning endeavor. This chart illustrates the top 20 variables that significantly influence customer ratings for the ski areas. On the vertical axis, you’ll find these pivotal variables, each drawn from the pool of customer reviews and amenity features. While the technical details and charts rest at the bottom for those who are interested, we’ll be steering clear of intricate data science algorithms within this blog post. Our aim is to reveal the enlightening findings that have surfaced.
Top 20 Most Pivotal Variables
Now, let’s dive into the core of these insights, bypassing the technical complexities and heading straight to the discoveries illuminated by our data and machine learning model.
Lift Operations in the Winter Ski Season: The word “lift” within customer reviews is the most significant variable for predicting customer ratings during the winter ski season. It echoes the sentiments unveiled in Part 3, where our sentiment analysis hinted at a similar trend.
View and Scenery in the Summer Season: As seasons shift, so do influential variables. In the non-winter ski season, the term “view” takes center stage within customer reviews, wielding considerable influence over customer ratings. This alignment mirrors our earlier observations from the sentiment analysis in Part 3.
Collaboration with Nearby Attractions: The count of nearby attractions emerges as the fourth most influential variable during the summer season, in stark contrast to its position as the 19th variable during the winter ski season. This divergence highlights a significant lesson: forming partnerships with local businesses and attractions is vital for ski areas aiming to diversify offerings beyond the ski-centric winter months.
The Role of Tours: Tours offered in each state gain relevance during the summer season, yet their importance diminishes in the winter. This insight further emphasizes the value of fostering connections with local enterprises, echoing the collaborative insight shared in the previous point.
The Enduring Significance of Staff: As seasons change, one constant remains— “staff.” This variable sustains its relevance in both winter and non-winter seasons, reflecting the robust findings we unveiled in Part 3 just last week.
Actionable Insights
Elevate Lift Operations and Scenery Highlights: Understanding the pivotal role of “lift” in winter and “view” in the non-winter seasons, ski areas can focus on enhancing these aspects to align with customers’ seasonal expectations. Ensuring smooth lift operations during winter and showcasing captivating views during other seasons can significantly impact customer satisfaction.
Forge Local Collaborations: The stark contrast in the relevance of nearby attractions between seasons underscores the importance of collaborating with local businesses. Ski areas should actively explore partnerships with nearby attractions, fostering a complementary experience that entices visitors to explore beyond the slopes.
Leverage Tour Offerings: Recognizing the varying significance of tours between seasons, ski areas can tailor their tour offerings to cater to the interests of summer visitors. Curating experiences that align with the preferences of seasonal visitors can contribute to a more engaging and diverse customer experience.
Maintain a Stellar Staff: The consistent influence of “staff” throughout both seasons reinforces the pivotal role of exceptional customer service. Ski areas should continue prioritizing staff training and engagement to ensure visitors receive exceptional service regardless of the time of year.
Customer-Centric Marketing: Tailor marketing campaigns to resonate with the influential aspects in each season. Highlighting these aspects in promotional materials can attract customers who prioritize them, leading to more targeted marketing efforts.
These actionable insights pave the way for ski areas to cultivate memorable experiences, foster customer loyalty, and ultimately thrive in a competitive market, regardless of the season.
Conclusion
In wrapping up this series, I’m grateful for the opportunity to explore the nuances of seasonality within the tourism industry. As we conclude this chapter, I’d like to extend an open invitation to all of you. If you have a specific tourism data topic that sparks your curiosity, please reach out. While my blogging pace might slow with the end of summer vacation, I’m committed to sharing insights through monthly posts.
Thank you for joining me on this journey through data-driven insights. Together, we’ve uncovered valuable understandings about customer preferences, harnessed the potential of online feedback, and laid the groundwork for more informed decisions in the world of tourism. Until we meet again, here’s to continued discovery and meaningful exploration through the lens of data.
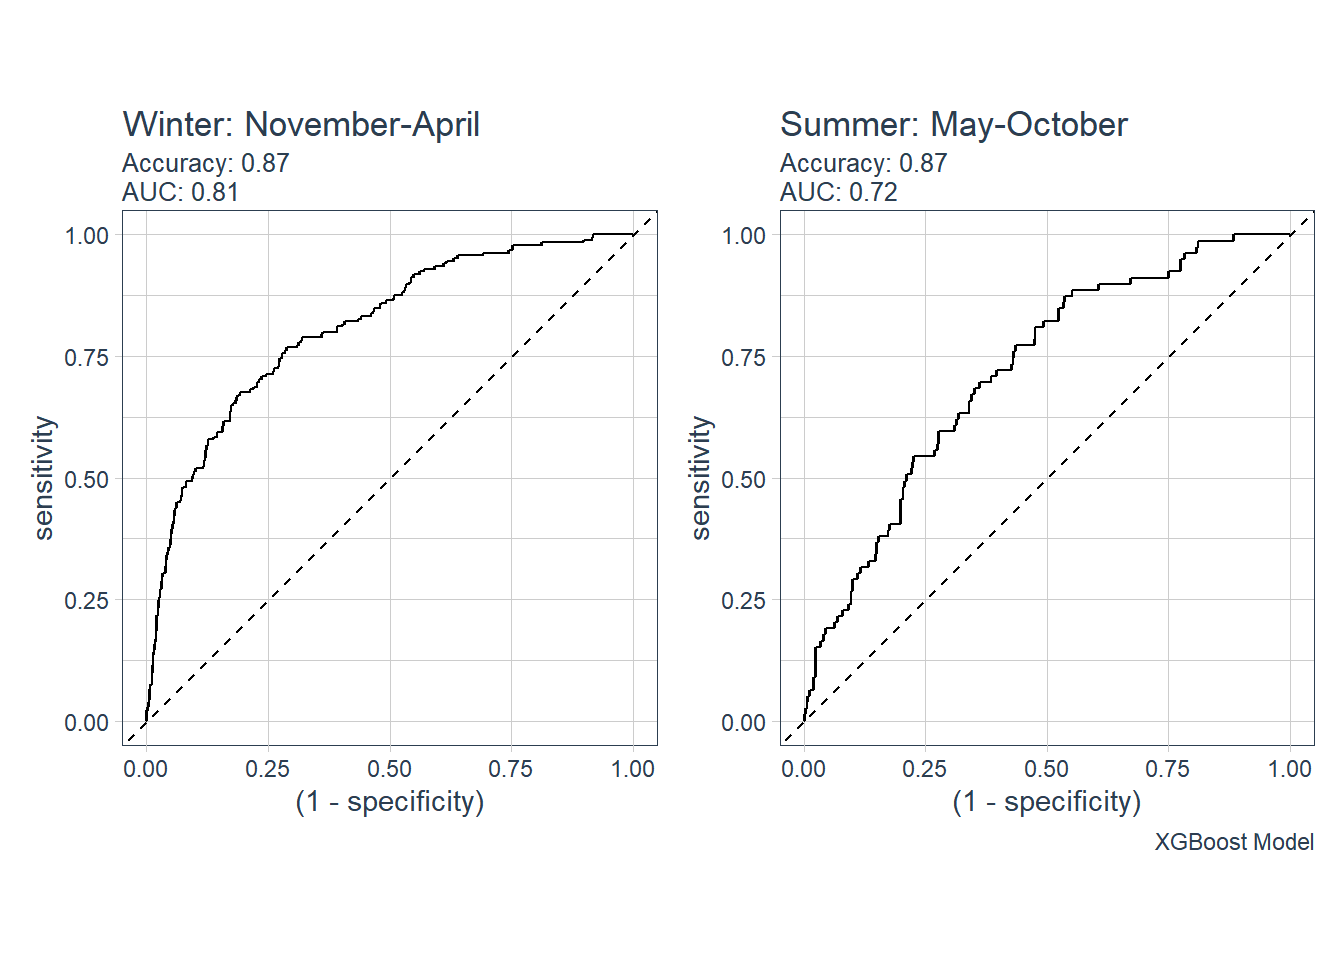
Model Evaluation
Both models, designed for the winter and summer seasons, exhibit commendable performance with an accuracy rate of 0.87. An accuracy falling within the range of 0.7 to 0.9 is generally considered good, while values surpassing 0.9 are deemed very good. This accomplishment underscores the models’ ability to make accurate predictions based on the input data.
Furthermore, delving into the Area Under the Curve (AUC) metric provides additional insights into model performance. The winter season model boasts an AUC of 0.81, indicating its stronger predictive prowess compared to the summer model, which achieves an AUC of 0.72. AUC values range from 0 to 1, where 0 signifies constant incorrect predictions, 1 represents flawless correctness, and 0.5 signifies random guessing. This evaluation affirms the winter season model’s heightened predictive capability in contrast to the summer counterpart. It’s likely due to the sample size: the ski areas attract more visitors during the winter ski season, therefore more customer reviews.